Wholesale Cannabis Price Index For The Week Ending On August 13th, 2021
Prices are down almost across the board in this weeks Cannabis Price Index
Cannabis Benchmarks®, a division of New Leaf Data Services, is a leading provider of financial, business and industry data for the North American cannabis markets, offering comprehensive and unique benchmark services for public and private organizations, and financial institutions.
Visit Cannabis Benchmarks on the web or read the free Cannabis Benchmarks Weekly Report here.
Wholesale market details for each state including price indices by cultivation method, detailed analysis, and commentary on the drivers of price change are available in the Cannabis Benchmarks Premium Report.
Cannabis Benchmarks® US Market Prices – All Indexes Are By Weighted Averages
| Commodity |
August 13th ($/lb) |
August 6th ($/lb) | $ Change | % Change |
|---|---|---|---|---|
| US Spot Index | $1,546.00 | $1,610.00 | $64.00 | 3.9% |
| US Indoor | $2,033.00 | $2,027.00 | $6.00 | 0.3% |
| US Greenhouse | $1,218.00 | $1,301.00 | $83.00 | 6.4% |
| US Outdoor | $741.00 | $804.00 | $63.00 | 7.9% |
| US Medical | $1,505.00 | $1,553.00 | $48.00 | 3.1% |
| US Adult-Use |
$1,567.00 |
$1,641.00 | $74.00 | 4.5% |
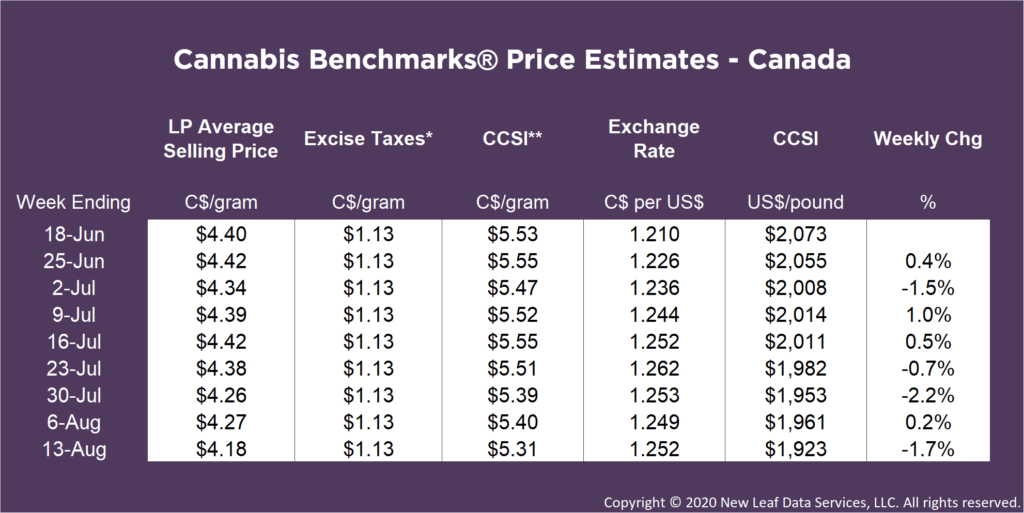
Cannabis Benchmarks® Canadian Market Prices – All Indexes Are By Weighted Averages
| Commodity | C$ Per Gram | C$ Per US$ | US ($/lb) | % Change |
|---|---|---|---|---|
| June 25th | $5.55 | $1.23 | $2,055.00 | 0.4% |
| July 2nd | $5.47 | $1.24 | $2,008.00 | 1.5% |
| July 9th | $5.52 | $1.24 | $2,014.00 | 1.0% |
| July 16th | $5.55 | $1.25 | $2,011.00 | 0.5% |
| July 23rd | $5.51 | $1.26 | $1,982.00 | 0.7% |
| July 30th | $5.39 | $1.25 | $1,953.00 | 2.2% |
| August 6th | $5.40 | $1.25 | $1,961.00 | 0.2% |
| August 13th | $5.40 | $1.25 | $1,961.00 | 1.7% |


